AI Taxonomy, Dashboard Insights, KPI Targets & Segment Automations
Version 4.5.0 — March 2nd, 2026
Faster taxonomy setup, smarter dashboards, and more control over your reporting workflows.
This release removes four recurring friction points for CX teams. You can now generate a structured taxonomy with AI, surface insights directly on your dashboard, track KPIs against real targets, and turn a segment into an automated workflow in two clicks. Less configuration. More time acting on what your customers are telling you.
The Problem
Getting value from feedback requires a lot of setup work that has nothing to do with analysis. Building a taxonomy takes days. Understanding why a score moved requires navigating away from the dashboard. Comparing KPIs to a fixed target isn't possible, only averages. And creating an automation from a segment involves too many disconnected steps.
These are not occasional issues. They're daily friction points that slow down CX teams at every stage of their workflow.
What's New in This Release
From blank slate to structured taxonomy in minutes
A well-structured taxonomy is the foundation of accurate feedback categorization. But building one from scratch has always been slow and manual, a barrier that delays time-to-value for new teams and new markets.
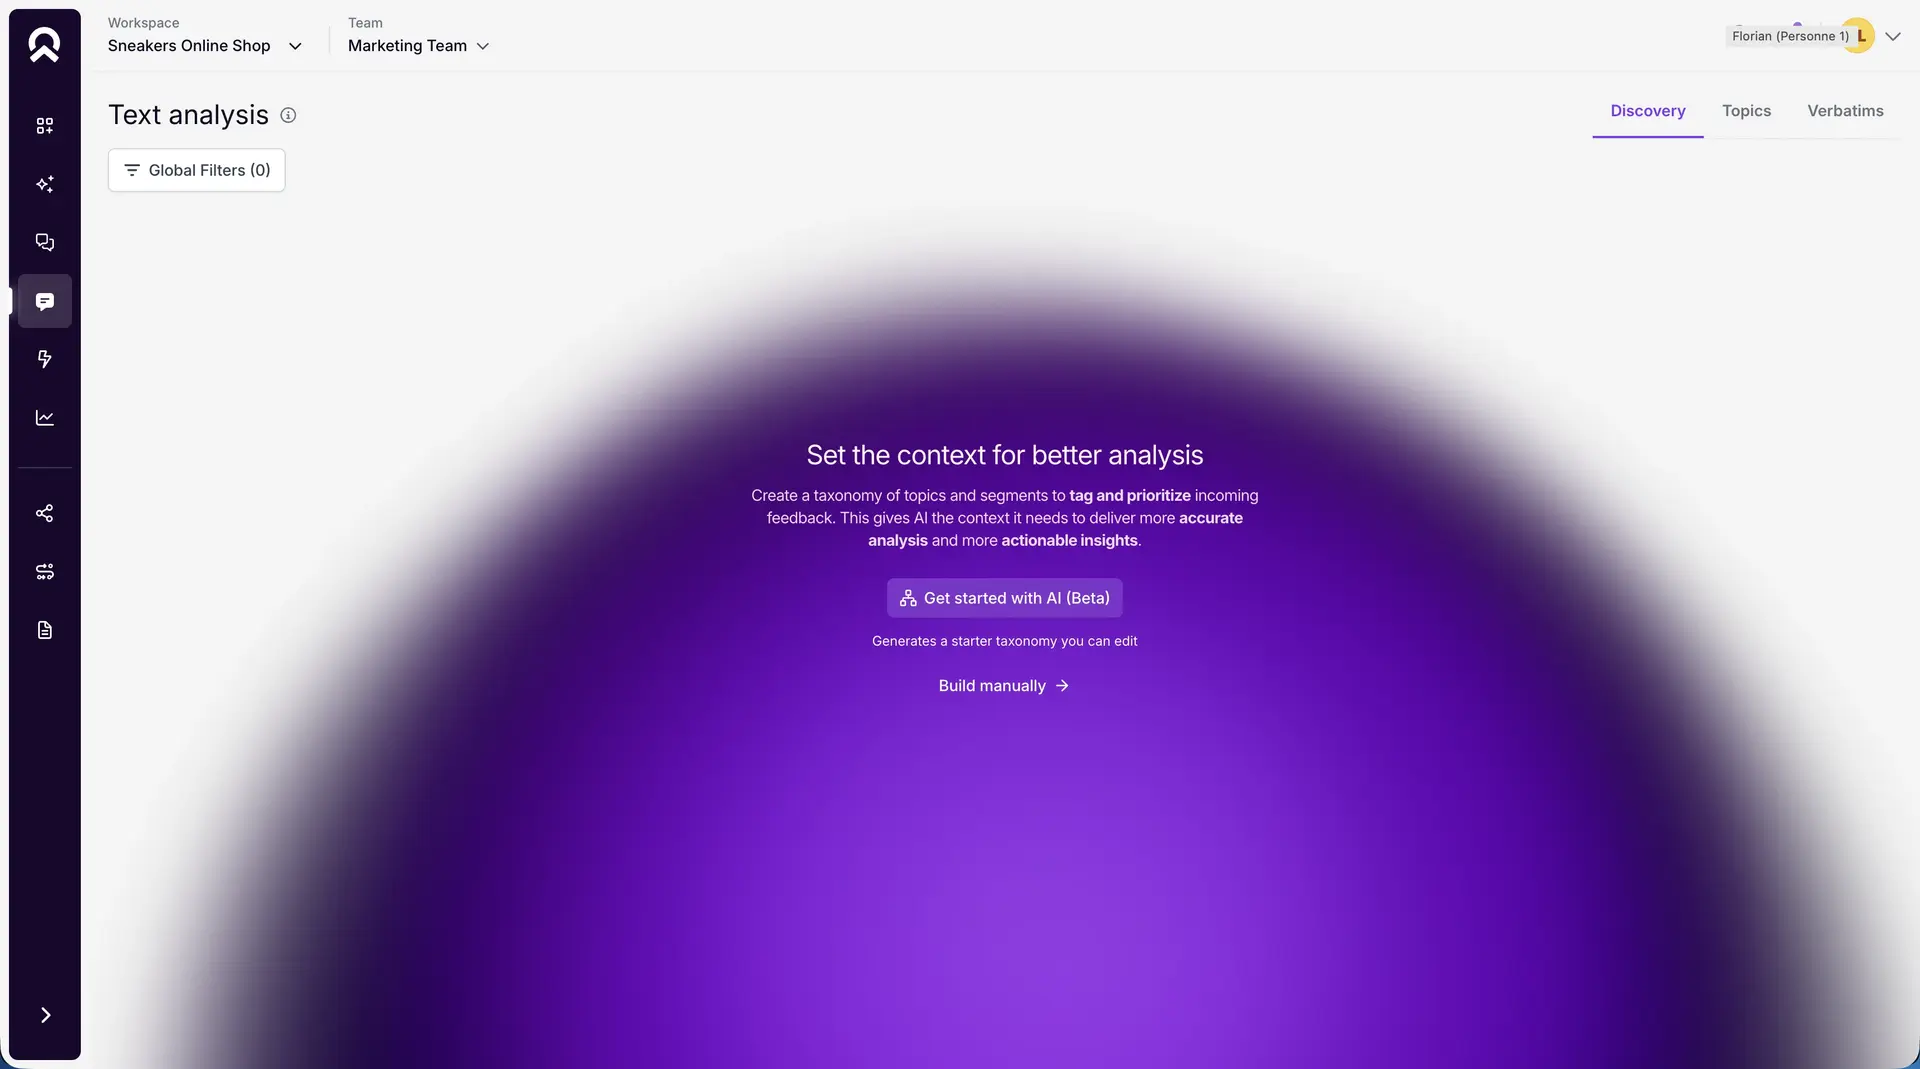
How it works
When creating a new team, you can now launch the AI-powered Taxonomy Generator (Beta). Describe your objectives and business context, and Feedier proposes a structured taxonomy tailored to your needs. You can also import an existing taxonomy to give the AI additional context. The generated taxonomy is fully editable at any point.
Why this matters
The faster you get your taxonomy right, the faster you get meaningful insights. This feature significantly reduces onboarding time and lowers the barrier to building a strong analytical foundation, for new teams, new markets, or new product lines.
When to use it
- Launch a new team with a ready-to-use taxonomy aligned with your business objectives
- Import an existing taxonomy and refine AI suggestions to match your current reporting structure
- Accelerate setup for new markets or business units
- Iterate quickly by adjusting generated categories before going live
This means you can go from zero to a structured, AI-refined taxonomy in minutes instead of days.
Insights and metrics in a single view
Insights were previously only available in Reports and Text Analysis pages. Getting a narrative understanding of feedback required navigating away from your main dashboard — breaking the flow of daily monitoring.
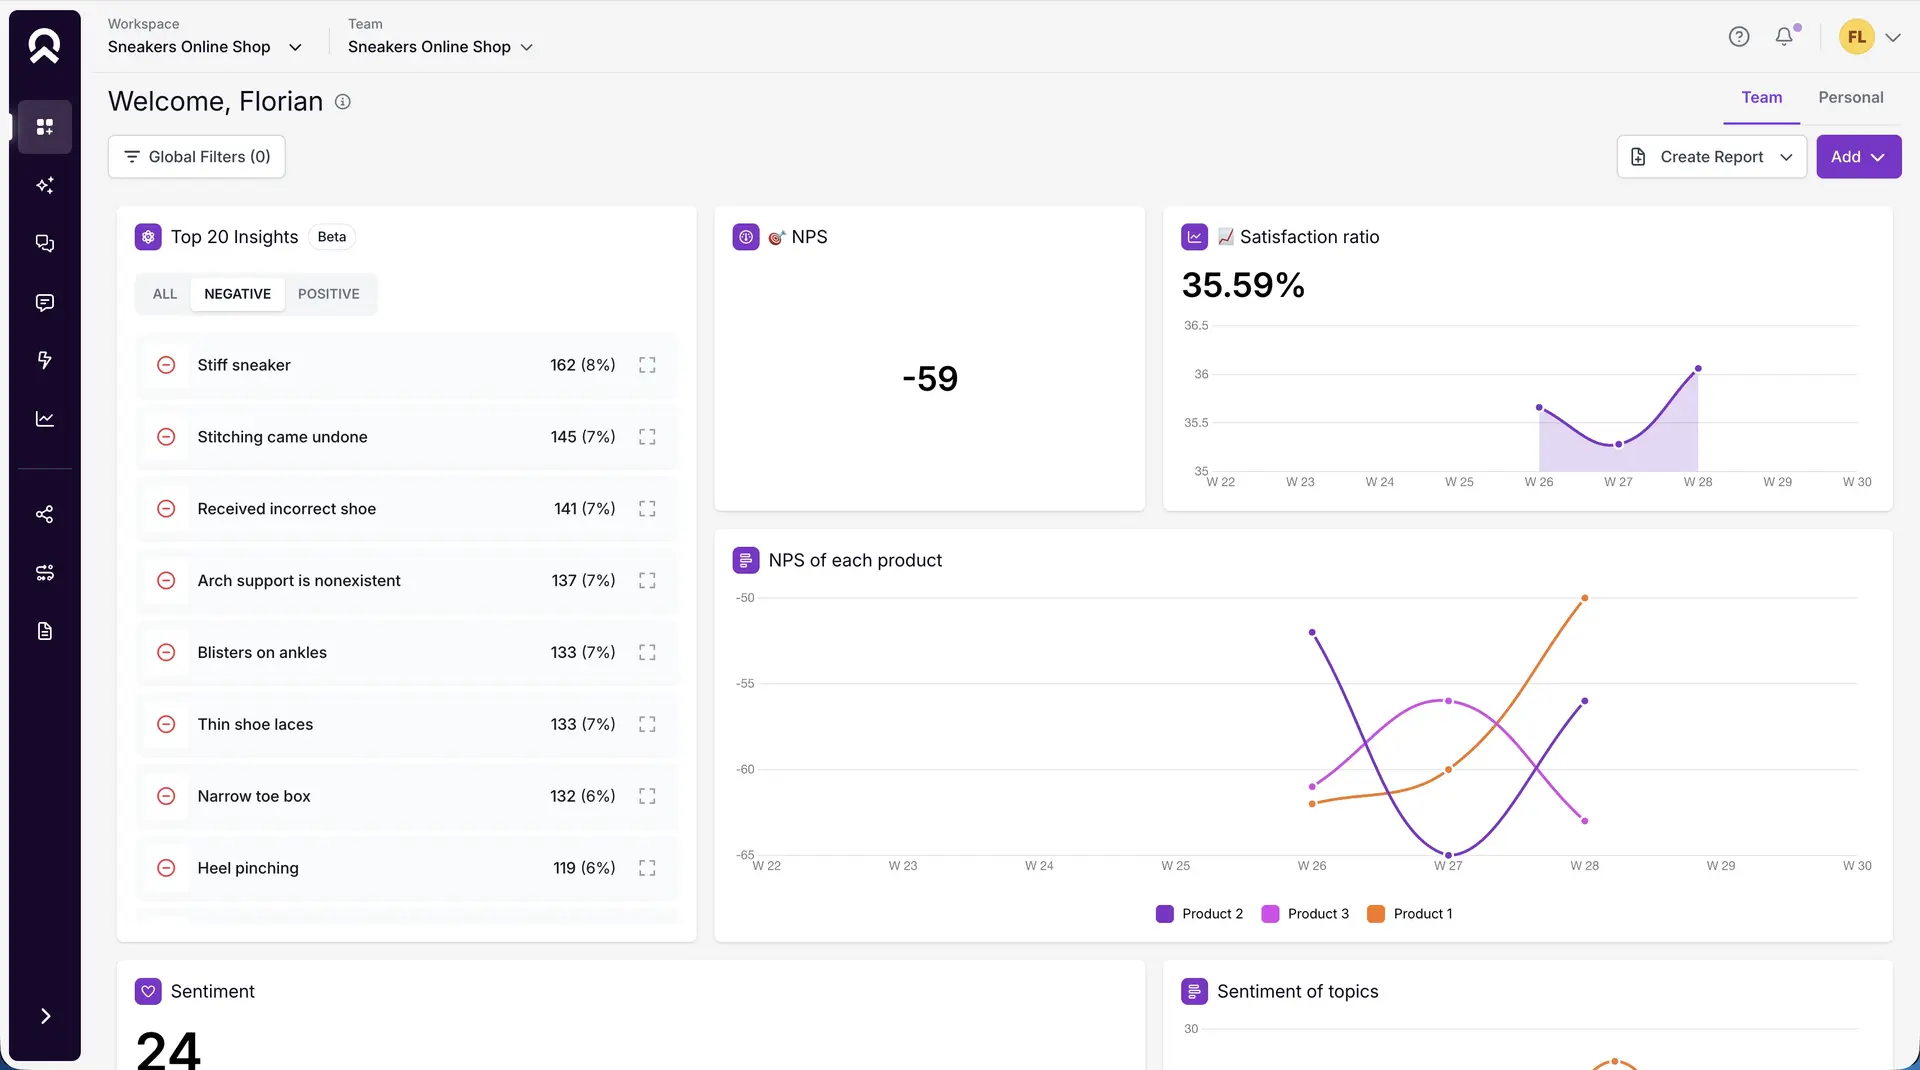
How it works
You can now add Insights as a component directly on the Dashboard. Combine KPI metrics and narrative analysis in a single view, right where your team starts their day.
Why this matters
Numbers alone don't drive decisions — context does. When insights appear next to your KPIs, your team immediately understands not just what is happening, but why. This is especially valuable for executive dashboards and day-to-day monitoring.
When to use it
- Build executive-ready dashboards that combine scores and narrative analysis
- Surface key learnings the moment team members log in
- Monitor evolving trends without switching between pages
- Create a single view that covers both measurement and interpretation
This means you can turn your dashboard into a genuine decision-making surface, not just a scorecard.
Track KPIs against real targets
Score Tables previously only allowed comparison against the overall average. There was no way to measure performance against a business objective, a contractual commitment, or a predefined threshold.
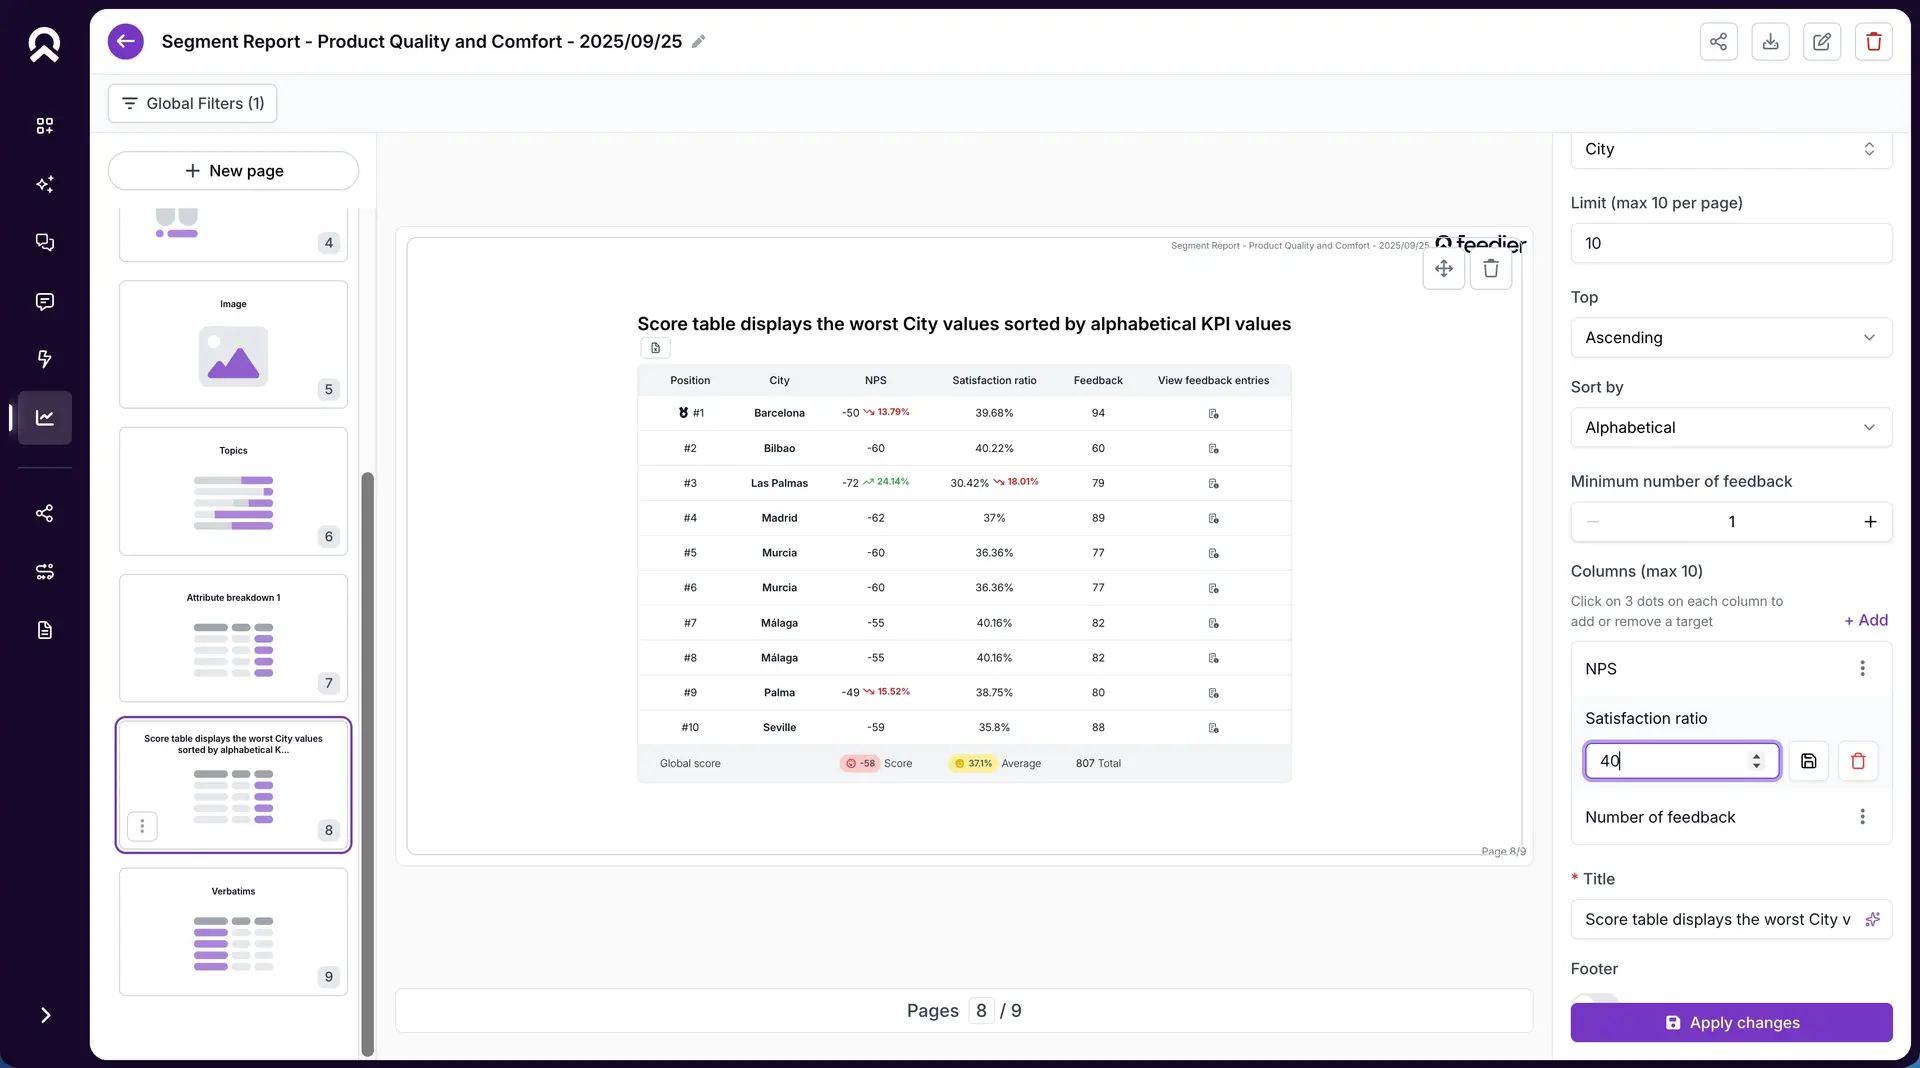
How it works
Each KPI column in a Score Table now includes an option to add a custom target. When a target is set, deviations are calculated against that target. When no target is set, the average-based comparison continues to apply — full backward compatibility.
Why this matters
Comparing to an average tells you where you stand relative to the group. Comparing to a target tells you whether you're meeting your goals. For teams with contractual obligations or internal benchmarks, this distinction is critical.
When to use it
- Set a contractual NPS target and track deviation across all locations
- Define an internal CSAT threshold and identify which segments fall below it
- Align KPI tracking with business objectives rather than statistical averages
- Share reports with stakeholders that reflect real performance expectations
This means you can build reports that reflect accountability, not just observation.
From segment to active workflow in two clicks
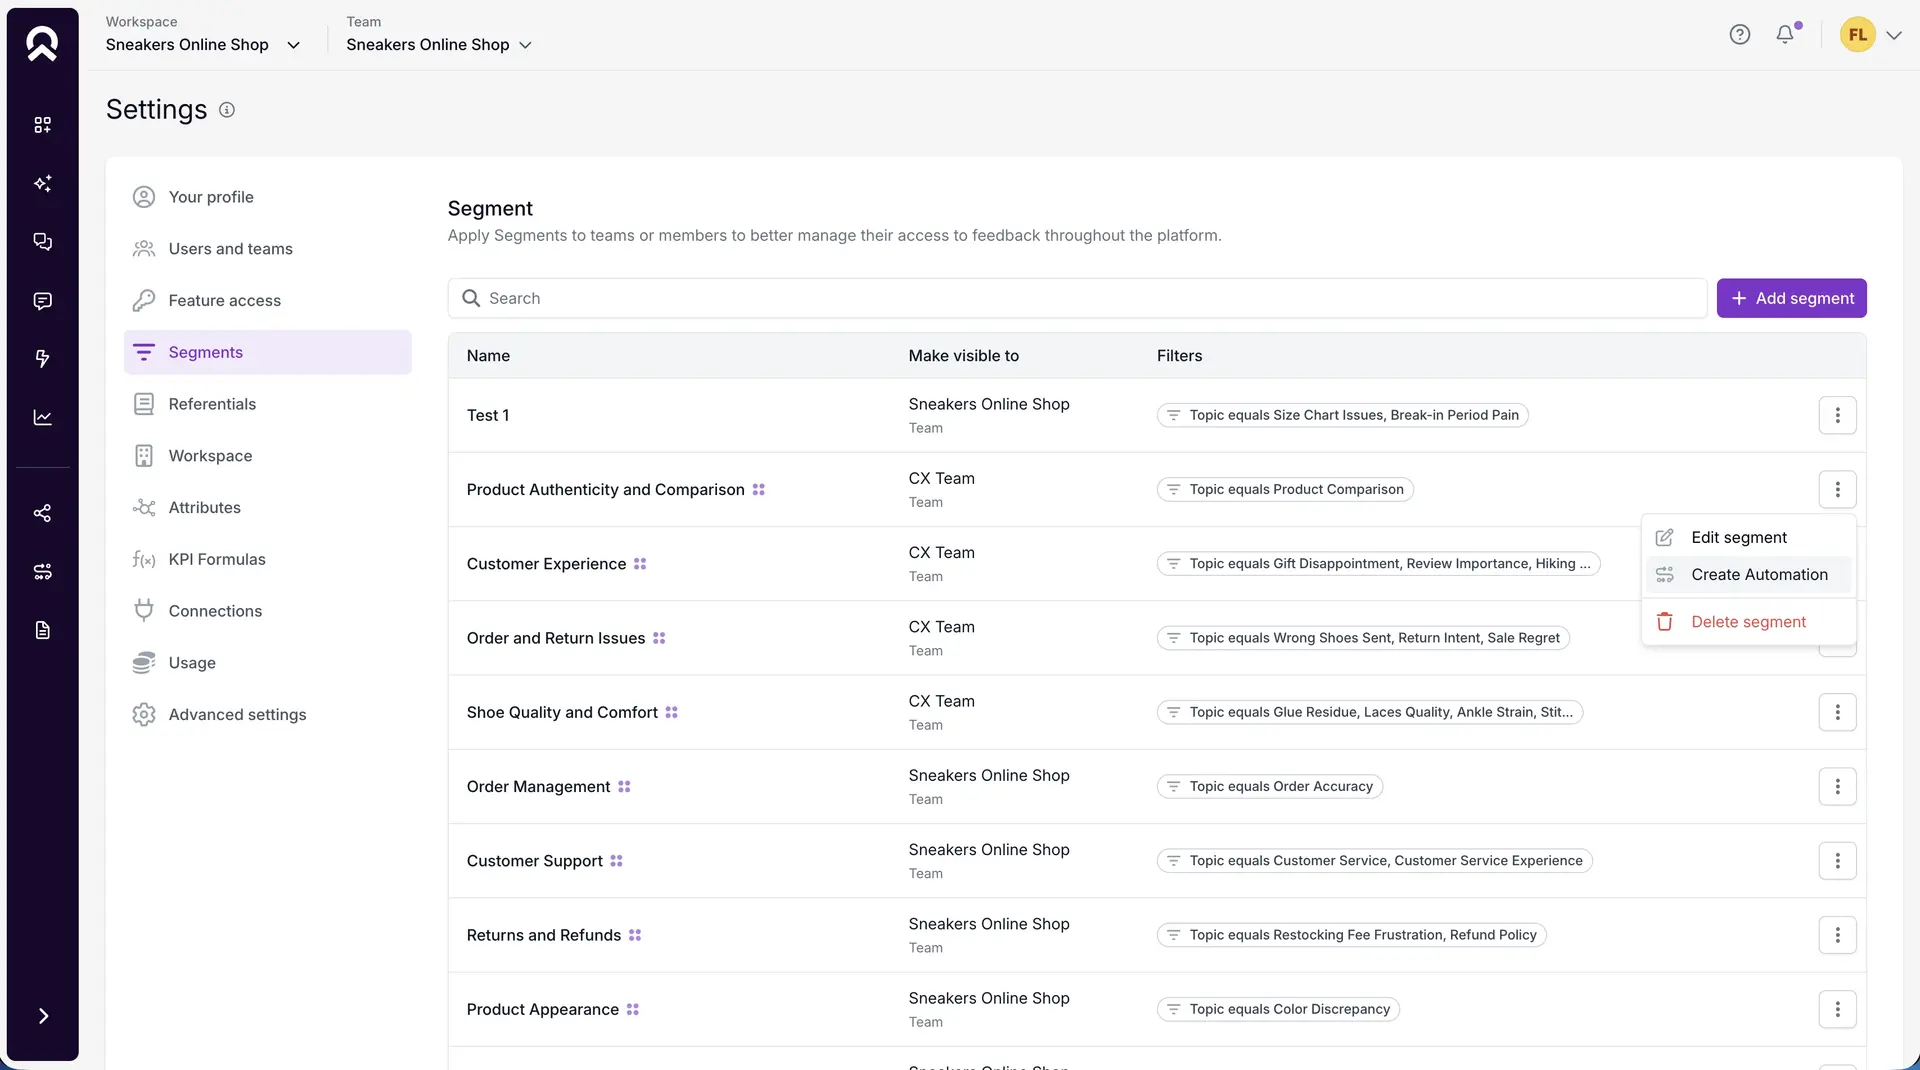
Creating automations based on segments previously required multiple disconnected steps: creating a locked segment, creating a separate automation segment, building the workflow manually, and configuring assignments again. This was repetitive and time-consuming.
How it works
After creating a segment, a modal now offers to automatically create a workflow. Choose between two automation types: User Assignation (automatically assign feedback to the right people when it matches the segment) or Daily Review (send a daily email with a direct link to the Live Feed filtered by that segment). Assigned users are pulled automatically from the segment's visibility settings.
Why this matters
Closing the loop between insight and action is one of the hardest parts of CX operations. When activating a response to a segment takes two clicks instead of ten steps, teams are far more likely to actually act on it. This reduces the gap between identifying a feedback pattern and doing something about it.
When to use it
- Automatically route negative feedback from a specific region to the local manager
- Set up a daily review email for a critical customer segment without manual configuration
- Assign feedback to account owners as soon as it matches their segment criteria
- Reduce operational overhead across multiple locations or segments
This means you can go from defining a feedback segment to activating a workflow in under a minute.
How to Access It
- AI Taxonomy Generator: Available when creating a new team. Look for the Taxonomy Generator (Beta) option in the team creation flow.
- Insights on Dashboard: Go to your Dashboard, click "Add component," and select Insights.
- KPI Targets: Open any Score Table in a report, click the 3-dot menu on a KPI column, and select "Add target."
- Segment-Based Automations: Create or edit a segment. A modal will appear after creation offering to set up an automation directly.
What This Release Changes for You
Version 4.5.0 removes friction at every stage of the CX workflow. Setup is faster with AI-assisted taxonomy creation. Analysis is richer with insights surfaced directly on your dashboard. Reporting is more meaningful with target-based KPI tracking. And operations are more efficient with automations that build themselves from your segments.
The result is less time configuring the platform and more time understanding your customers, and acting on what they're telling you.
Try it in your workspace, or contact your Feedier team if you want a walkthrough.
Download our complete Voice of Customer Guide to get the most out of your program

Our articles for further exploration
A selection of resources to inform your CX decisions and share the approaches we develop with our clients.