A completely rebuilt reporting experience
Version 4.8.0 — April 23rd, 2026
This release does not add features on top of what existed. It replaces the entire reporting module with something built from scratch.
You can now build reports with a grid-based drag-and-drop system, present them directly from Feedier, ask anything about your customers directly with Ask Feedier, and collaborate in real time with your team. For CX teams that live inside reports, this is a fundamentally different experience.
The reality of CX reporting before this release
Building reports in Feedier worked — but it was far from effortless. Moving components required workarounds. Charts looked functional, but not polished enough to present directly to senior stakeholders. When it came time to present, you had to export and rebuild somewhere else. When two people worked on the same report, they could overwrite each other's changes without knowing it.
The friction was real. And for teams that use reports daily to communicate customer insights across the organization, it added up.
What's New in This Release
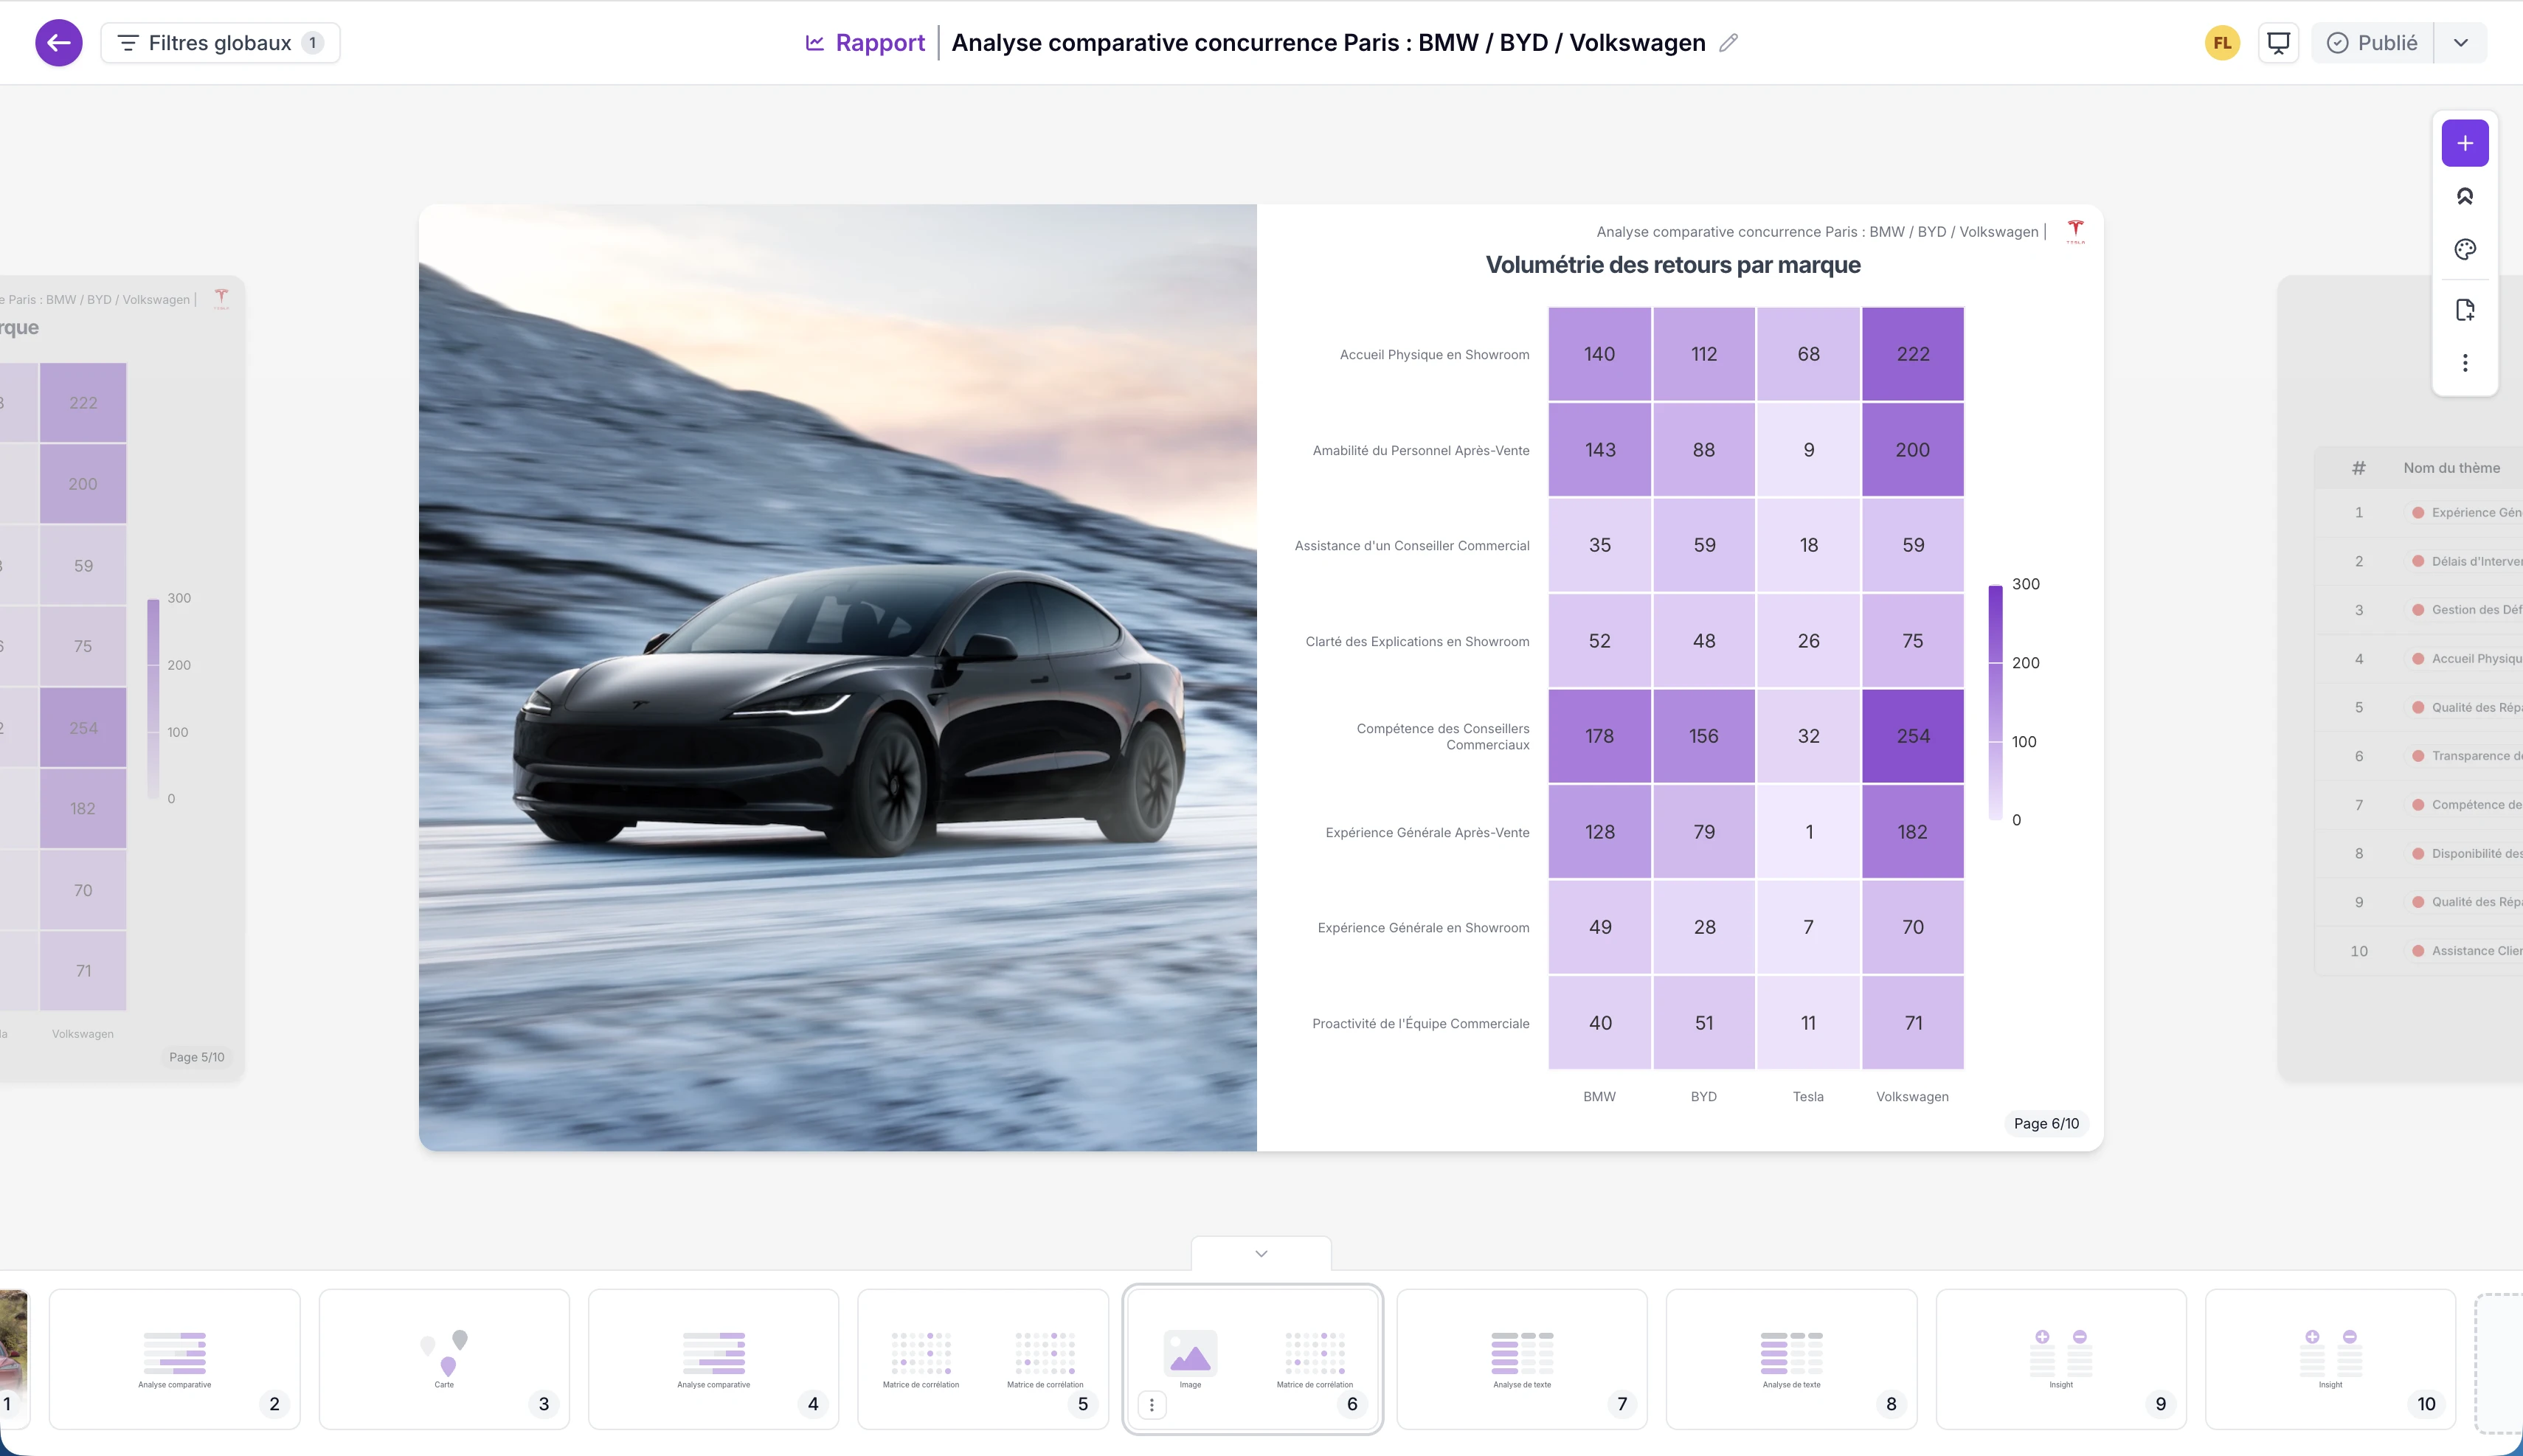
A report canvas built for clarity and speed
What it does
The report layout has been completely redesigned. Components now live on a grid-based canvas with free-form drag-and-drop positioning — you can place anything anywhere and resize freely, with up to four slots per row. Charts are now premium-quality, using the full available space, and every metric includes an explanatory tooltip so stakeholders always know what they're looking at.
Why it matters
A clean, well-structured report communicates credibility. When your charts look sharp and your layout is deliberate, insights land differently in executive conversations. This update removes the gap between "internal report" and "boardroom-ready presentation."
Practical use cases
- Reorganize your NPS dashboard in minutes without workarounds
- Build dense, information-rich reports that still feel readable
- Share reports directly with stakeholders who immediately understand what each chart measures
This means you can go from raw data to a polished report that's ready to share in a fraction of the usual time.
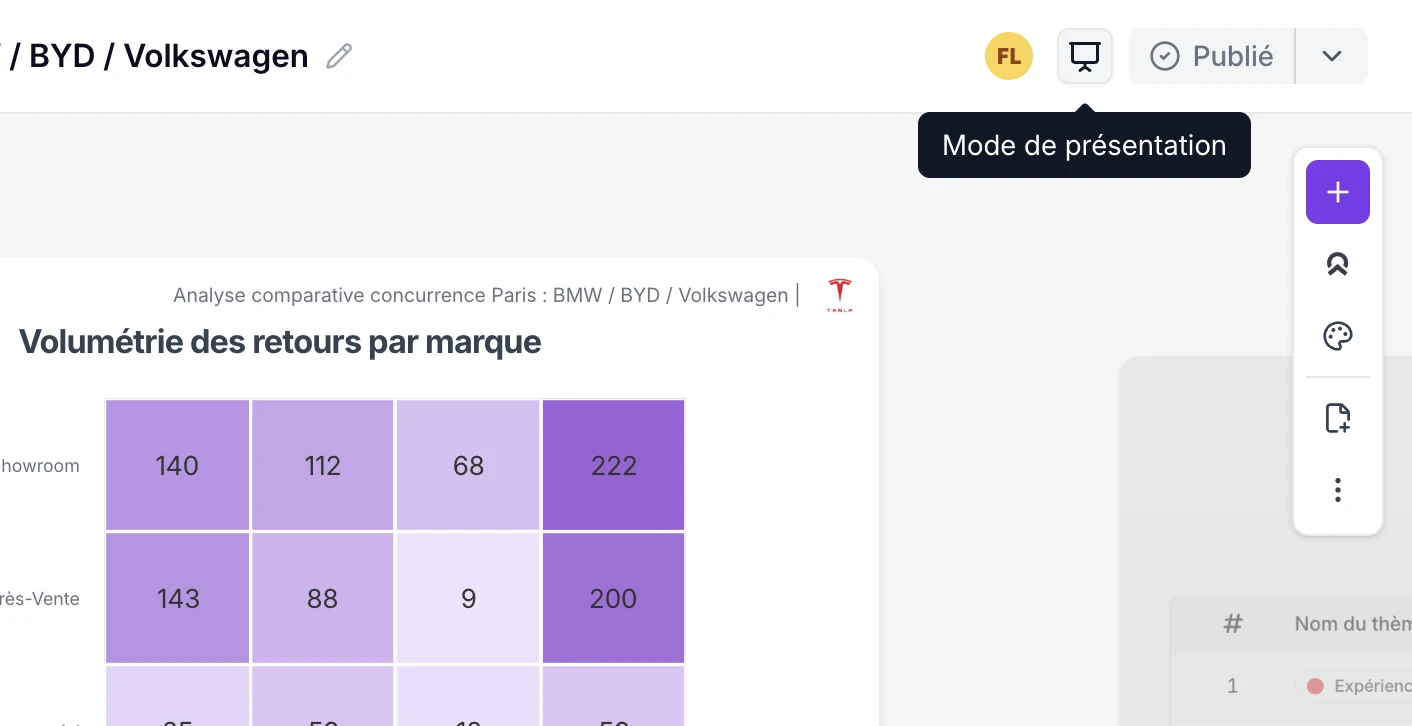
Present reports directly from Feedier
What it does
A new presentation mode lets you navigate through your report slide by slide, using keyboard controls, without ever leaving Feedier. No export, no PowerPoint rebuild, no formatting lost in translation.
Why it matters
Every step between your data and your audience is a step where clarity can be lost. Presentation mode removes those steps entirely. The report you built is the report you present — with all the live data intact.
Practical use cases
- Present your monthly CX review directly from the platform
- Walk your team through feedback trends in a structured, linear format
- Deliver executive briefings on customer satisfaction without a separate deck
This means you can present customer insights to any audience, at any time, directly from your workspace.
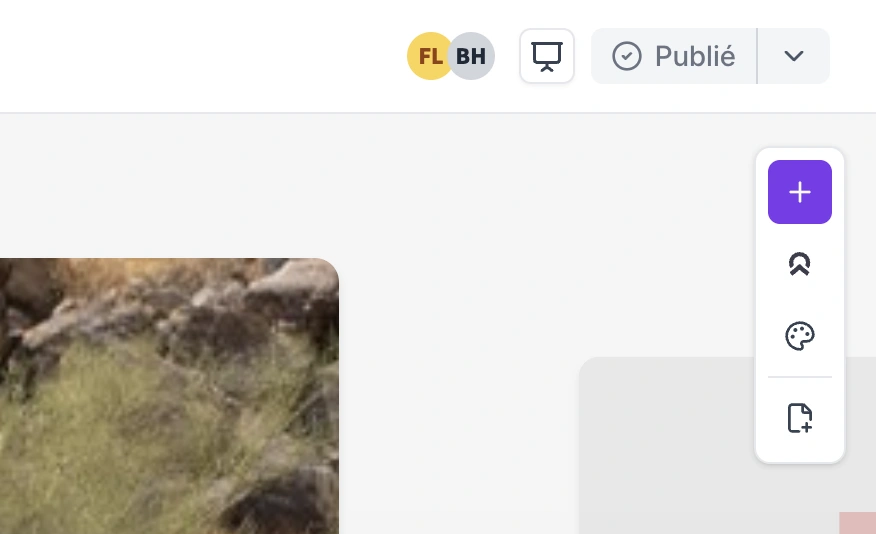
Collaborate on reports in real time
What it does
You can now see who else is viewing a report live. Component locking prevents two people from editing the same element simultaneously. Changes sync instantly for all users.
Why it matters
CX teams rarely work alone. When insight leads, analysts, and business partners work on the same report, coordination failures create errors. Real-time collaboration turns report-building into a team activity — without the version-control problems.
Practical use cases
- Co-build a quarterly review with a colleague without overwriting each other's work
- See when your manager is reviewing the same report you're editing
- Iterate on report structure as a team in a live session
This means you can build reports together, not after each other.
Ask Feedier in your reports
What it does
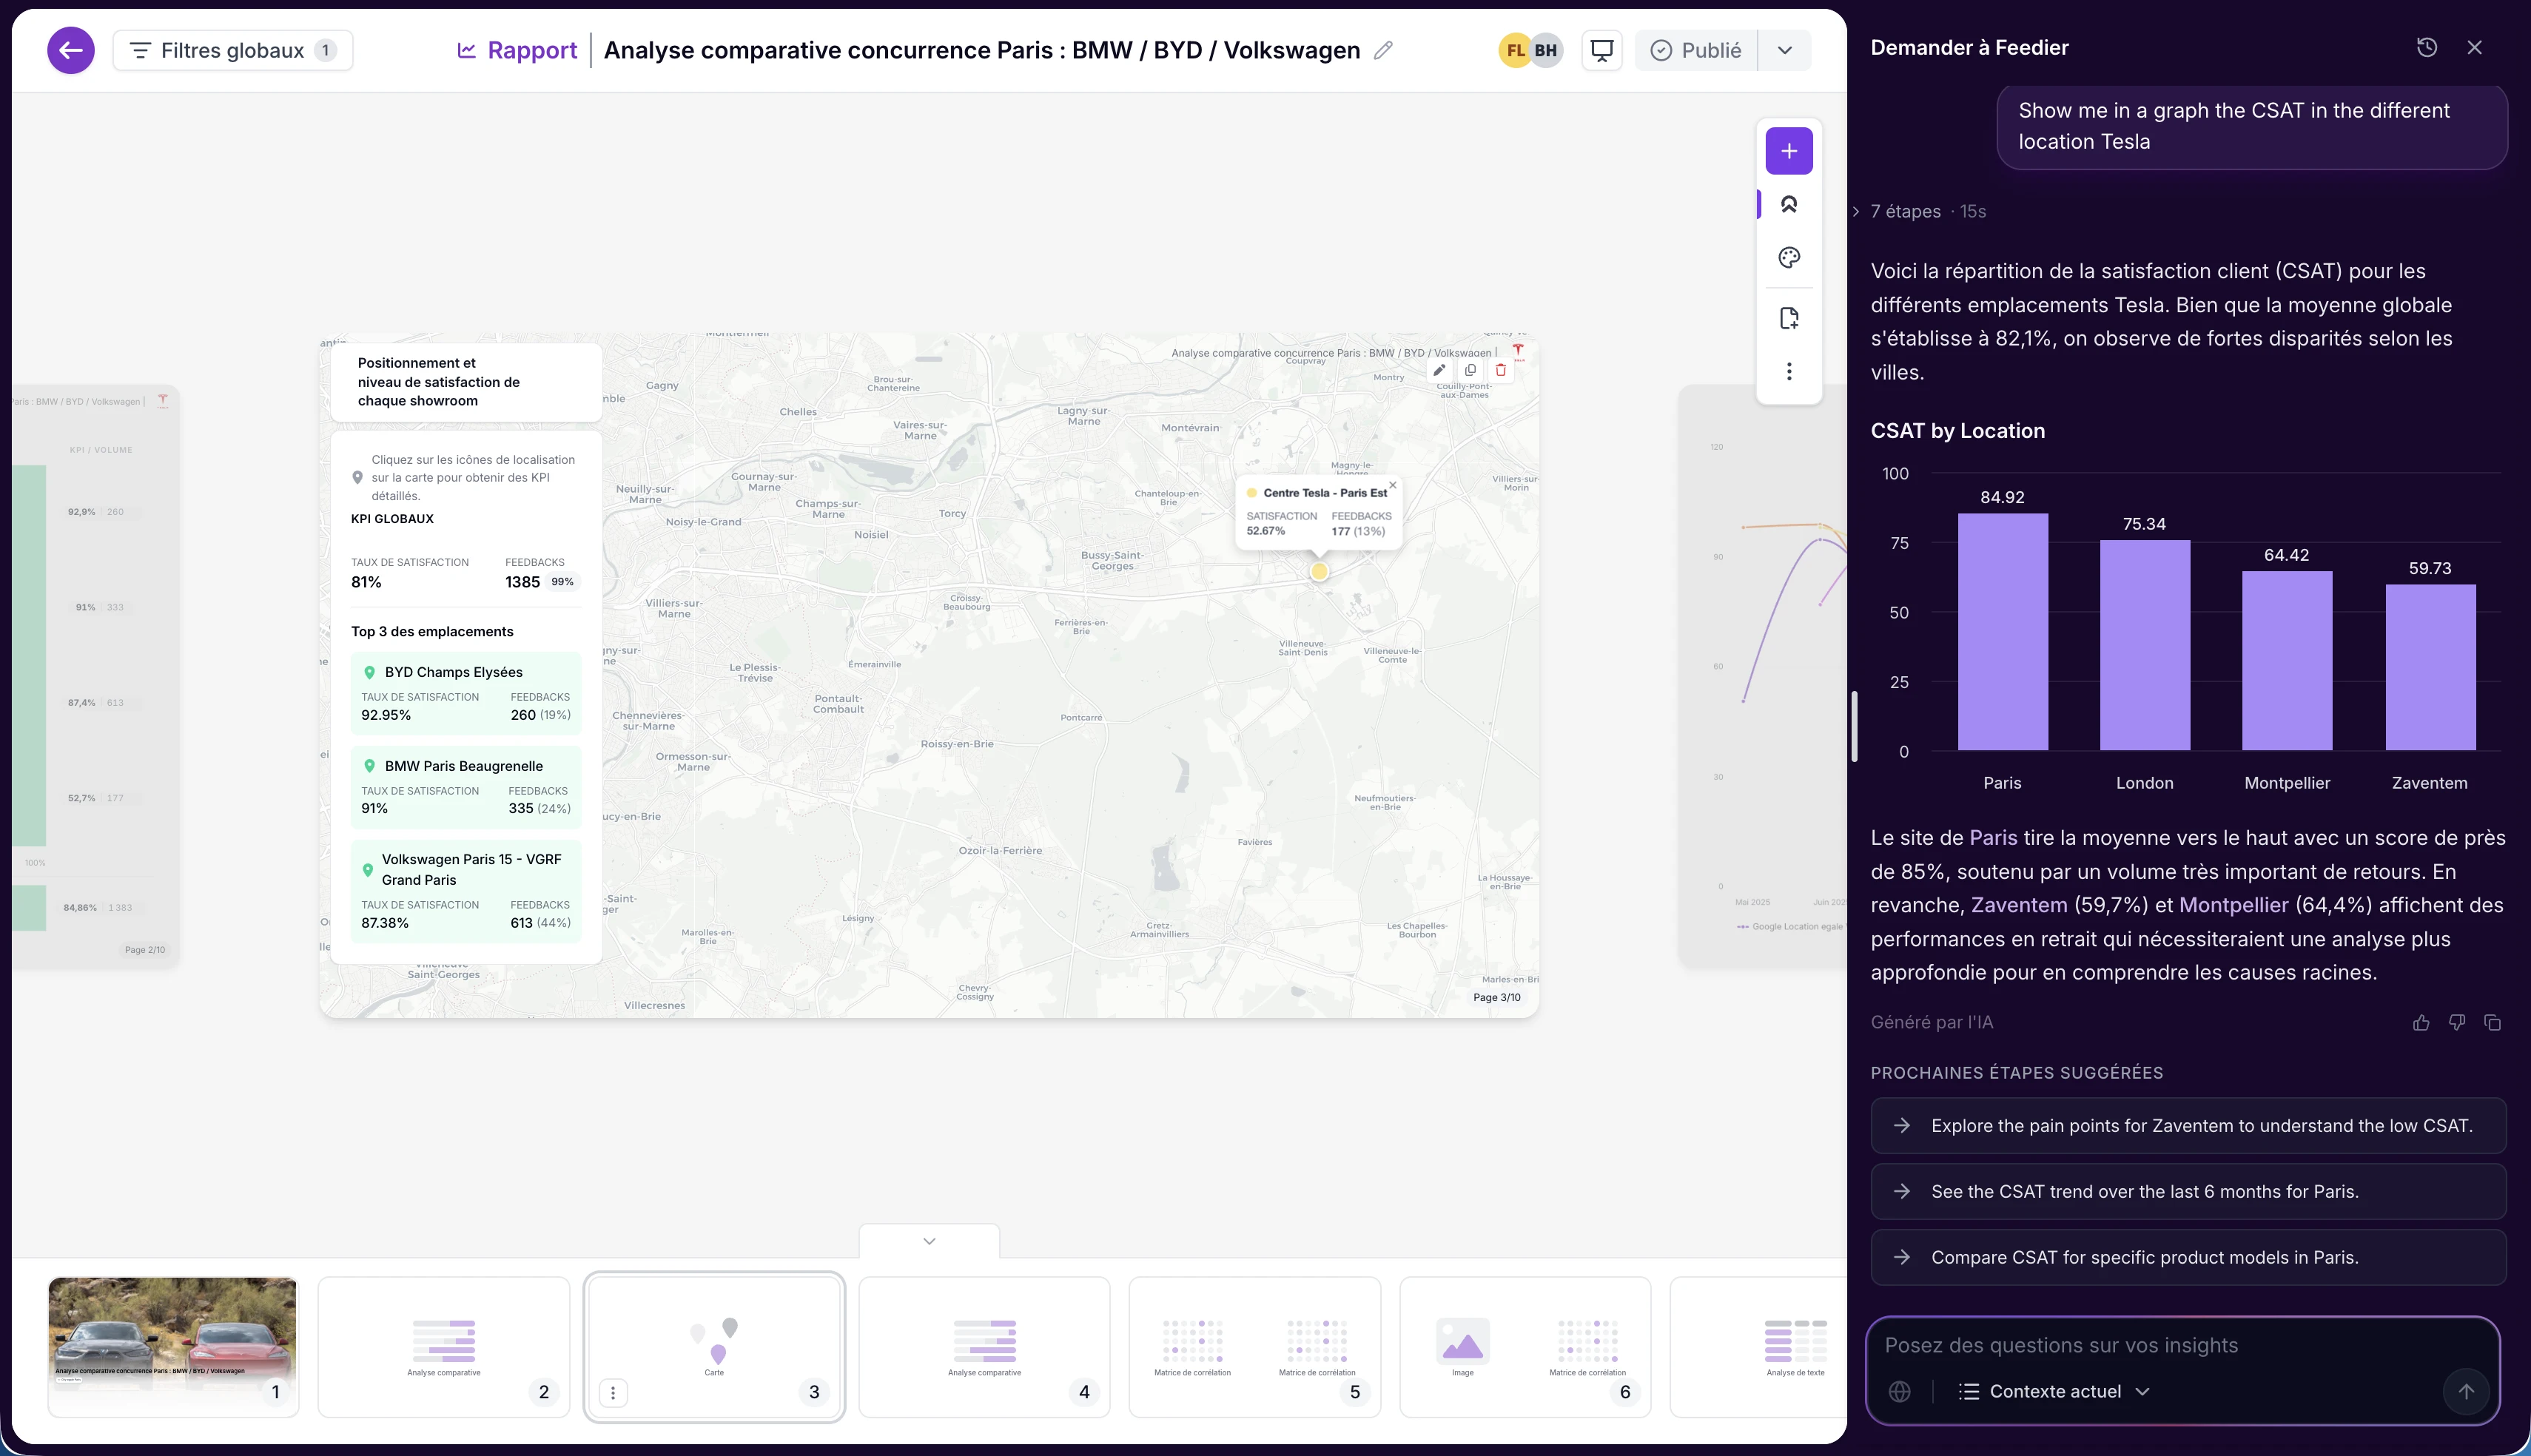
A new Ask Feedier button is now available directly inside any report. You can literally ask anything about your customers — Feedier has the answer. Your question is instantly turned into report components — charts, summaries, and insights — built directly into the report.
Why it matters
Moving from feedback signals to structured insights has always required multiple steps across different tools. Ask Feedier brings the analysis layer directly into the reporting surface. You ask a question about your customers. The answer appears as a component in your report.
Practical use cases
- Generate a detailed breakdown of your top negative feedback themes directly in your quarterly report
- Ask Feedier to explain a satisfaction drop and embed the analysis as a chart
- Build research-backed insight components without leaving the platform
This means you can move from a question about your customers to a shareable insight, without switching tools.
How to Access It
The new Reports module is available now for all users. Open the Reports section in Feedier to find the new canvas. Presentation mode is accessible from the report toolbar. To try Ask Feedier, open any report and click the Ask Feedier button in the component menu.
What This Release Changes for You
Version 4.8.0 makes reporting in Feedier qualitatively different. The speed of building a report is faster. The quality of the output is higher. The ability to present and collaborate is now native. And with Ask Feedier in BETA, the distance between a question about your customers and a structured, shareable answer is shrinking.
For CX teams that use reports to move the organization, this release removes the friction that was slowing you down.
Try it in your workspace.
Download our complete Voice of Customer Guide to get the most out of your program

Frequently Asked Questions
Features, security, integration, support... Find here the answers to the most frequently asked questions about Feedier.
For any specific request, our team is here to listen.
It makes it faster to reorganize dashboards, create denser layouts that stay readable, and produce charts that look polished enough to present without exporting.
It makes it faster to reorganize dashboards, create denser layouts that stay readable, and produce charts that look polished enough to present without exporting.
No. You can present directly inside Feedier using the new presentation mode, keeping live data and avoiding PowerPoint or slide rebuilds.
Real-time collaboration shows who is viewing, syncs changes instantly, and uses component locking to prevent people from editing the same element at the same time.
It is a beta feature that lets you ask anything about your customers directly inside a report — Feedier generates the answer and turns it into report components like charts, summaries, and insights.
Our articles for further exploration
A selection of resources to inform your CX decisions and share the approaches we develop with our clients.