[4.16.0] Business Impact Score & PowerPoint Export
Version 4.16.0 — 16th July 2026
A Clearer Path from Feedback to Action
This release gives CX teams two things they've been asking for: a clear number that shows what to fix first, and a faster path from analysis to stakeholder presentations.
Business Impact turns your feedback signals into a single prioritization score. PowerPoint export makes your reports ready to share in one click. For teams that spend too much time deciding where to start and rebuilding slides from data, this changes both.
The Problem
CX teams often sit on rich feedback data but struggle to answer one simple question: what should we actually focus on?
Sorting through sentiment scores, ratings, NPS, and volume across dozens of topics takes time, and the answer isn't always obvious. And once the analysis is done, turning it into a presentation for stakeholders means exporting charts, reformatting, and rebuilding slides from scratch. Work that adds hours to every review cycle, without adding insight.
What's New in This Release
Know What to Fix First
One number. All your signals.
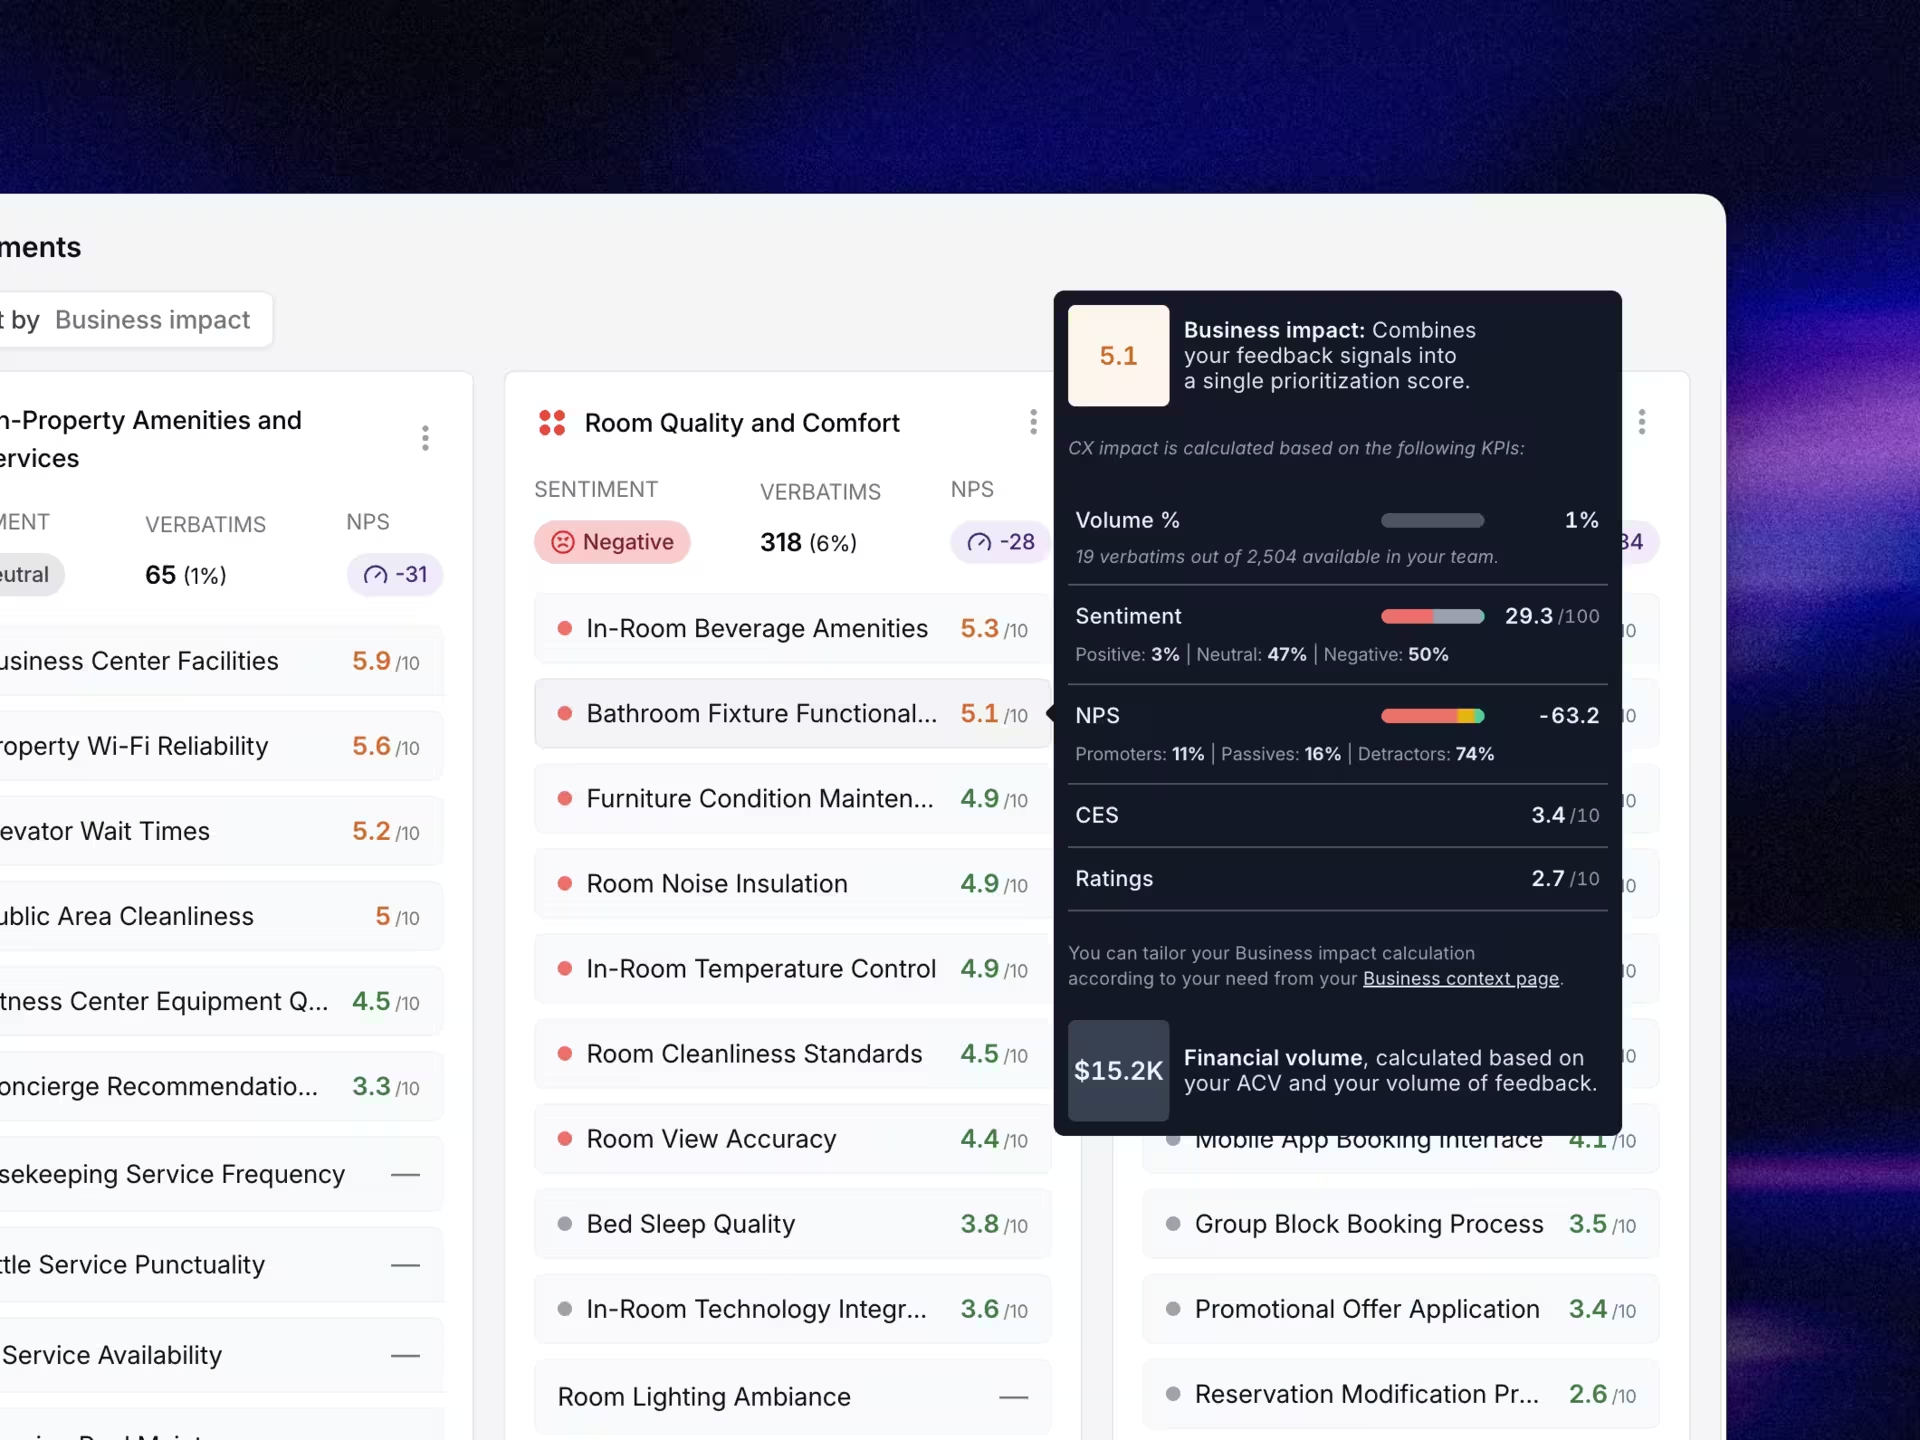
Business Impact is a new prioritization score from 0 to 10 that combines your feedback signals, sentiment, ratings, NPS, Customer Effort Score, and volume, into a single number. It works as a ranking lens across the platform, displayed as a sortable column in your Topics lists inside Text Analysis.
A higher score means higher priority, shown with a color band: red for high, orange for medium, green for low. Volume is always included; other signals are configurable in Analyst Setup > Business Impact.
Why it changes your workflow
Without a clear priority signal, every topic can feel equally urgent. Business Impact removes the guesswork. It tells you, at a glance, which customer pain points carry the most weight, factoring in how often they appear, how negatively customers feel, and how strongly they deviate from expectations.
You can also add financial context, customer value, issue handling cost, to estimate the monetary weight behind each score. This bridges the gap between feedback analysis and business decision-making.
Where to start
- Sort your Topics list by Business Impact to instantly rank what needs attention
- Track trends over time: each score shows a badge comparing it to the previous period
- Ask Ask Feedier "What are my top topics by Business Impact this month?" for a narrative summary
- Add financial context in Analyst Setup > Business Impact to estimate cost per issue
This means you can move from a list of 30 topics to a clear, ranked action list in seconds, without manual analysis.
From Report to Presentation in One Click
No more rebuilding slides
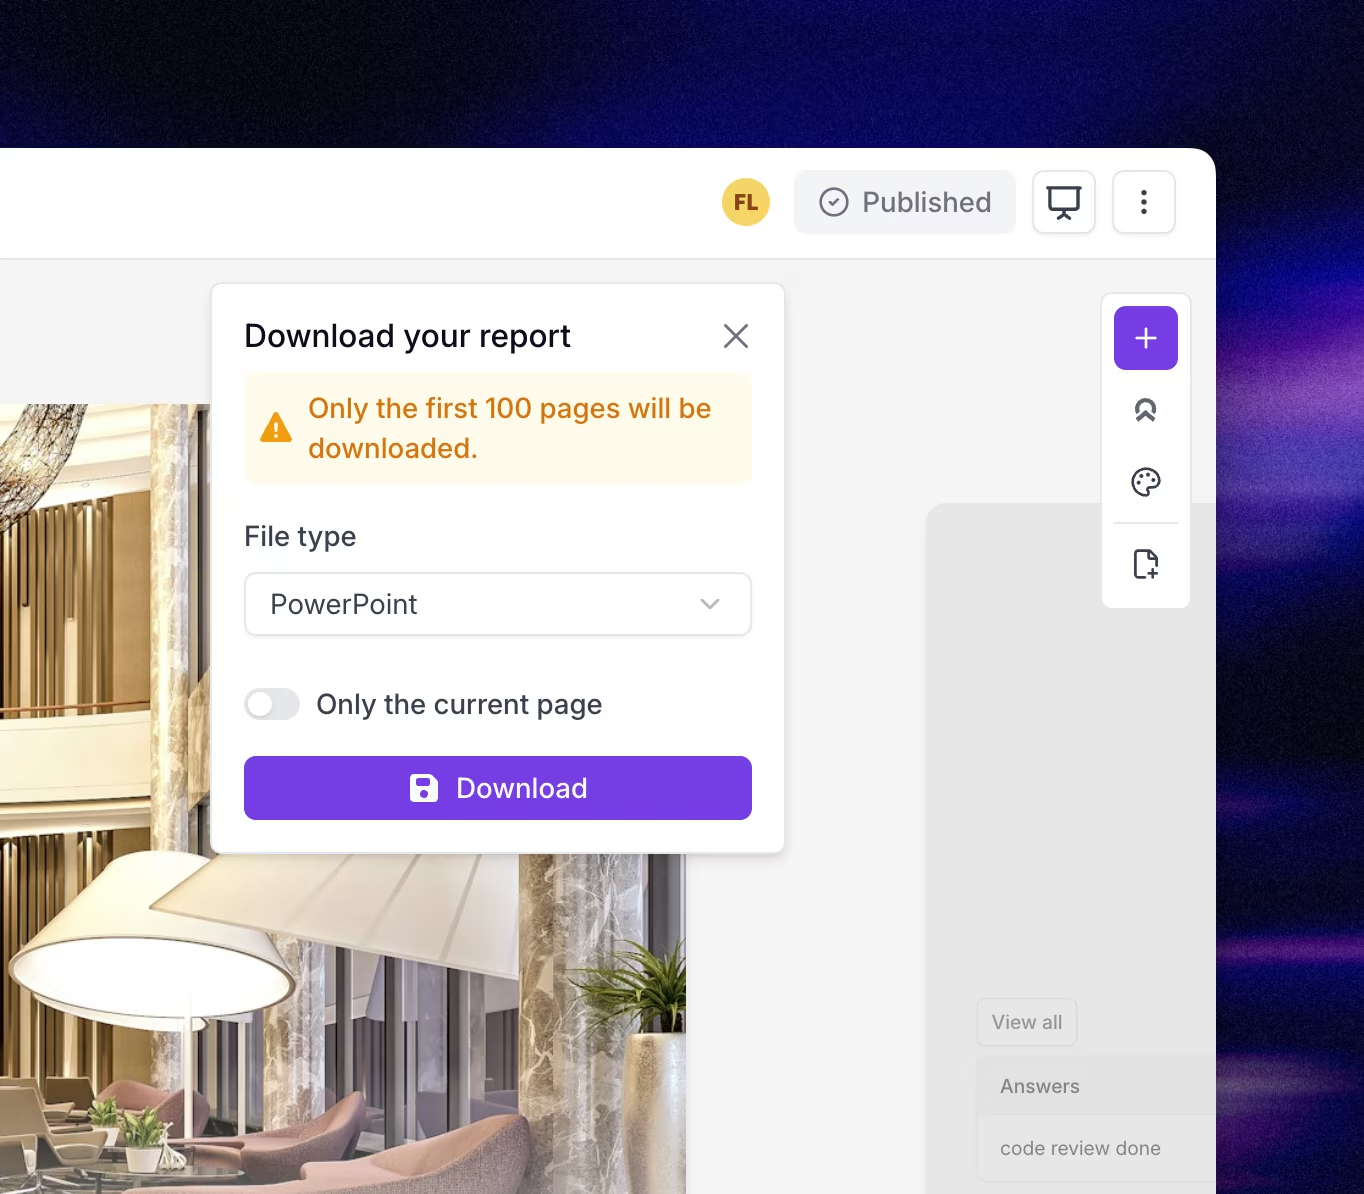
You can now export any Feedier report as a PowerPoint (PPTX) file. The export preserves the report's full layout, charts, tables, and visuals, ready to drop directly into a presentation. This is a beta feature that currently works best with Microsoft PowerPoint.
Why it matters for stakeholder reporting
Turning a Feedier report into a stakeholder presentation used to mean screenshot by screenshot. Now the entire report becomes a structured slide deck in one action. CX leaders can share insights in the format their audience expects, without rebuilding anything.
For teams that brief leadership or cross-functional partners regularly, this removes a recurring drain on time that adds nothing to the quality of the analysis.
How to use it
- Open any report and click Download, then select PPTX
- The exported file keeps your charts, tables, and visual layout intact
- Drop it directly into a presentation or share it with stakeholders as-is
This means you can go from analysis to boardroom-ready slides without leaving Feedier.
How to Access It
Business Impact: Go to Analyst Setup > Business Impact to activate signals. Choose which signals to include (Sentiment, Ratings, NPS, Customer Effort Score). Once live, Business Impact appears as a sortable column in your Topics lists in Text Analysis.
PowerPoint export: Open any report, click Download, and select PPTX.
Both features are available to all Feedier users.
What This Release Changes for You
Version 4.16.0 makes two recurring frustrations disappear. You no longer need to weigh topics manually to decide what to prioritize, Business Impact does it for you, in real time, with your own data. And you no longer need to rebuild your analysis into slides, the PPTX export does it in a single click.
For CX teams that brief stakeholders regularly, this release recovers real time in every reporting cycle. Decisions get clearer. Sharing gets faster. The gap between insight and action gets smaller.
Try It Now
Try it in your workspace. If you want a walkthrough, contact your Feedier team.
Level 4? You're Level 2
Get the Five Levels of Voice of Customer Maturity

Our articles for further exploration
A selection of resources to inform your CX decisions and share the approaches we develop with our clients.