
Prioritize smarter, explore deeper, and filter faster.

Version 4.17.0 — August 3rd, 2026
This release puts your most important signal — Business Impact — everywhere you work in Feedier. You can now drill into any insight directly from a report, add Ask Feedier charts to dashboards in one click, and build filters with a redesigned inline interface. For CX teams, it means a faster path from signal to decision.
The Challenge CX Teams Face
When you're managing hundreds of feedback signals across segments, sources, and touchpoints, finding what matters most takes too long. Business Impact scores lived in one place. Insights in reports were hard to explore further. Building a filter took multiple clicks. And charts created in Ask Feedier had to be manually rebuilt in reports. These small frictions add up to slower reporting cycles and delayed decisions.
What's New in Version 4.17.0
Business Impact, Now on Every Object Across the Platform

Your most important prioritization signal, everywhere.
The Business Impact score (0 to 10) now appears across the entire platform — not just in your Topics lists. You can see it and sort by it in Score tables, Insights, Topic Segments, the Attributes tab, and on actions in your Action Plans. It's also available as a benchmarking widget in Reports and Dashboards.
Why It Matters
Prioritization only works when the signal is available at every decision point. Before, switching between views meant losing track of which topics and actions carried the most business weight. Now, the same color band, trend badge, and sort capability follow you everywhere — so the highest-impact items always rise to the top.
Practical Use Cases
- Sort your Action Plan by Business Impact to tackle what matters most first
- Compare Business Impact across segments in your Score tables to identify where to focus resources
- Track Business Impact trends in Reports and Dashboards alongside other KPIs
- Use it as a benchmarking widget to show stakeholders what's improving
This means you can prioritize consistently across the platform without switching context.
Drill Into Any Insight With the New Insights Analysis View
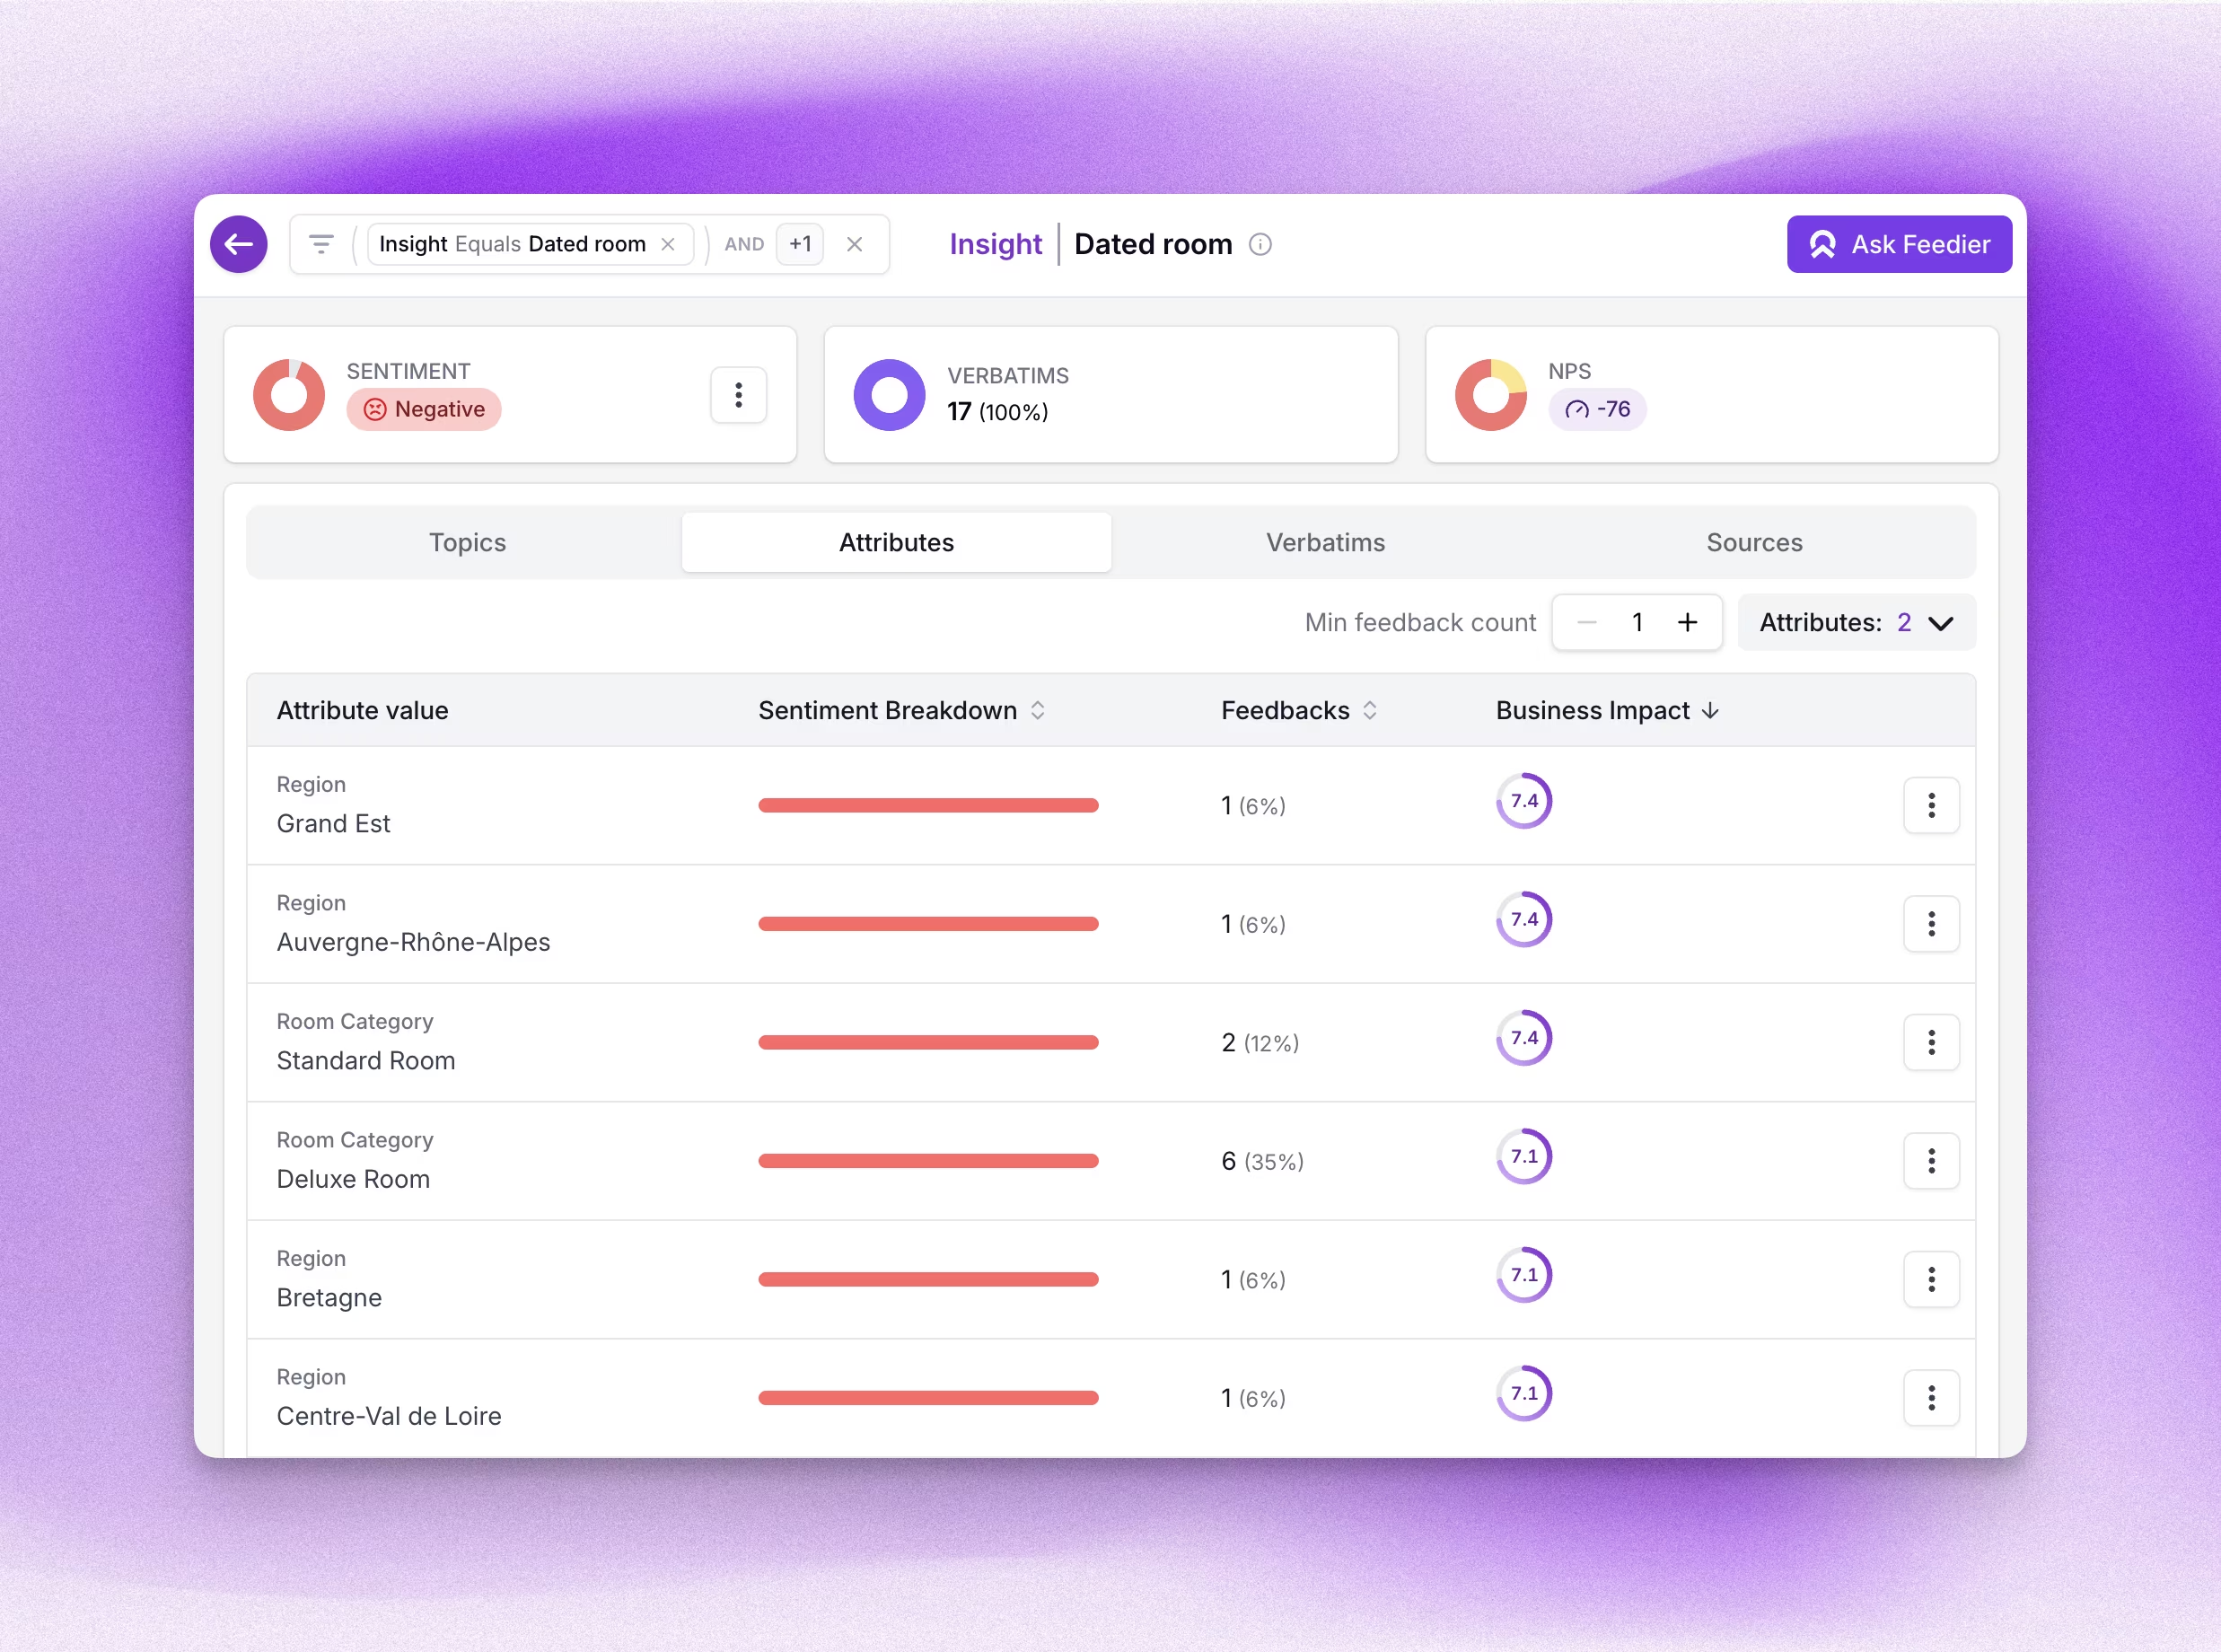
From a chart click to a full investigation, in seconds.
Click any insight in a report or dashboard to open a dedicated Insights Analysis view. It carries over your current filters and scope — date range, segments, sources, and the component's focus — and lets you explore topics, attributes, verbatims, and sources without rebuilding your analysis from scratch.
Why It Matters
Insights in reports were a starting point, not a destination. When something caught your attention, you had to leave the report, reconstruct your filters in another view, and try to match the same scope. Now the analysis opens exactly where you left off — scoped to the insight you clicked, with all your context preserved.
Practical Use Cases
- Click a spike in a negative sentiment insight to explore the verbatims behind it
- Drill into a specific topic from a dashboard to see which segments are most affected
- Explore sources contributing to a trend without losing the report's date range
- Share a focused analysis view with a colleague instead of an entire report
This means you can move from a high-level signal to a full root-cause investigation without leaving your flow.
Add Ask Feedier Charts Straight to a Report

Your AI-generated charts, now permanent fixtures in your reports.
When Ask Feedier builds a chart in chat, you can now add it to any report in one click. If the chart is tied to a live metric, it stays live and refreshes with the report's filters. If Ask Feedier reworked the data — sorting, top N, filtering, or pulling an external source — it saves as a snapshot, captured exactly as shown.
Why It Matters
Ask Feedier accelerates analysis, but the output used to stay in the chat window. Getting those charts into a report meant screenshotting or rebuilding them manually — a process that broke the analysis flow and introduced inconsistencies. Now the insight lives where it should: in the report, alongside everything else.
Practical Use Cases
- Build an executive summary report by adding Ask Feedier charts to an existing dashboard
- Save a custom top-N analysis as a snapshot in a report for stakeholder sharing
- Keep a live Ask Feedier chart refreshed in a recurring report
- Combine AI-generated charts with native components in a single view
This means you can build richer, faster reports without ever leaving the analysis flow.
Faster, More Powerful Filters
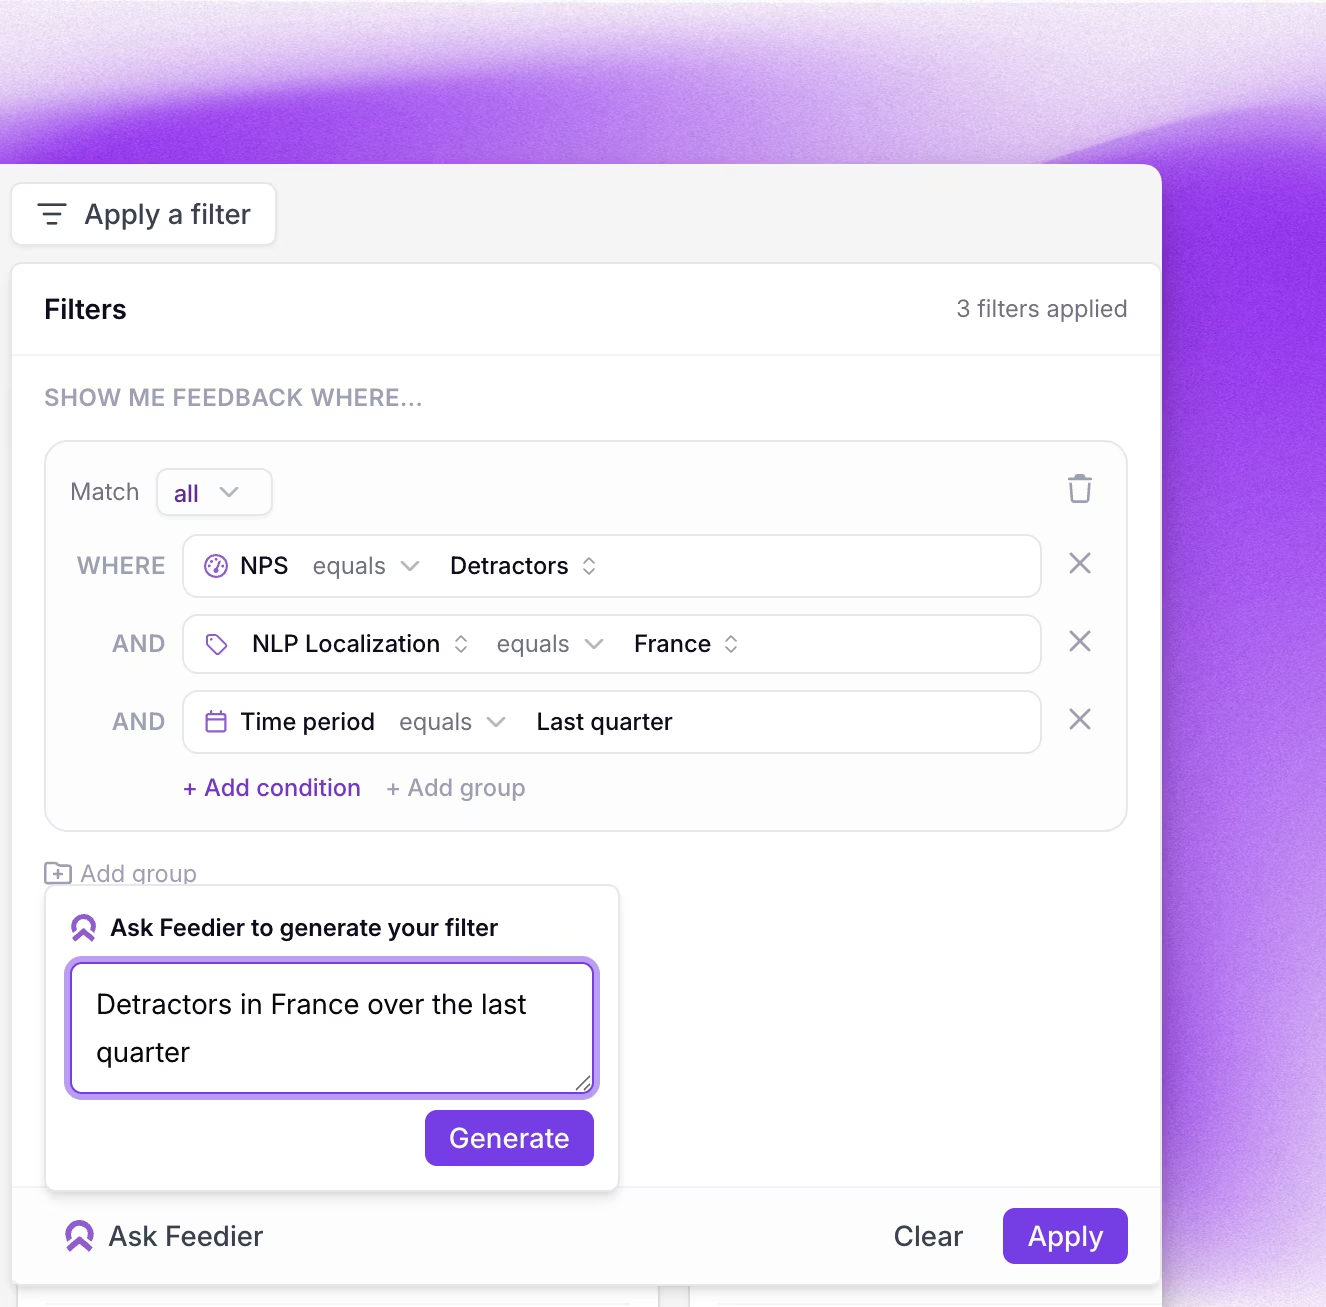
Edit filters inline, add them with AI — no more multi-step flows.
Global Filters get a full redesign. Each filter is now a single inline pill split into selector, operator, and value — click any part to change it, and the update applies instantly. You can also use AI to generate a filter directly from a natural-language prompt.
Why It Matters
Filters are the most-used tool in any analytics platform. The previous flow required multiple steps to build or change a filter, which slowed down every slice-and-dice operation. The new design reduces friction to a single click, and AI-assisted filter creation means you can describe what you want in plain language and get there immediately.
Practical Use Cases
- Quickly adjust an existing filter by clicking directly on its value
- Use a prompt like "show only negative feedback from last quarter" to create a filter with AI
- Build complex filter combinations faster with the inline editor
- Switch between segments and time periods with minimal clicks
This means you can spend more time reading insights and less time configuring your view.
How to Access It
All features in this release are available to all users. Business Impact appears automatically across Score tables, Insights, Topic Segments, the Attributes tab, Action Plans, and Reports. The Insights Analysis view opens from any insight click in a report or dashboard. The Ask Feedier chart addition is available from the chat interface. The new filter UI is live in Global Filters across the platform.
What This Release Changes for You
Version 4.17.0 removes the distance between signals and decisions. Business Impact follows you across the platform so nothing important gets lost. Insights become starting points for deeper investigation rather than endpoints. Ask Feedier output becomes permanent, shareable content. And filters respond instantly to your intent — including when you describe it in plain language. The result is a faster, more connected analysis experience across every workflow.
Level 4? You're Level 2
Get the Five Levels of Voice of Customer Maturity

Our articles for further exploration
A selection of resources to inform your CX decisions and share the approaches we develop with our clients.